Student Name: Ivanna Lin
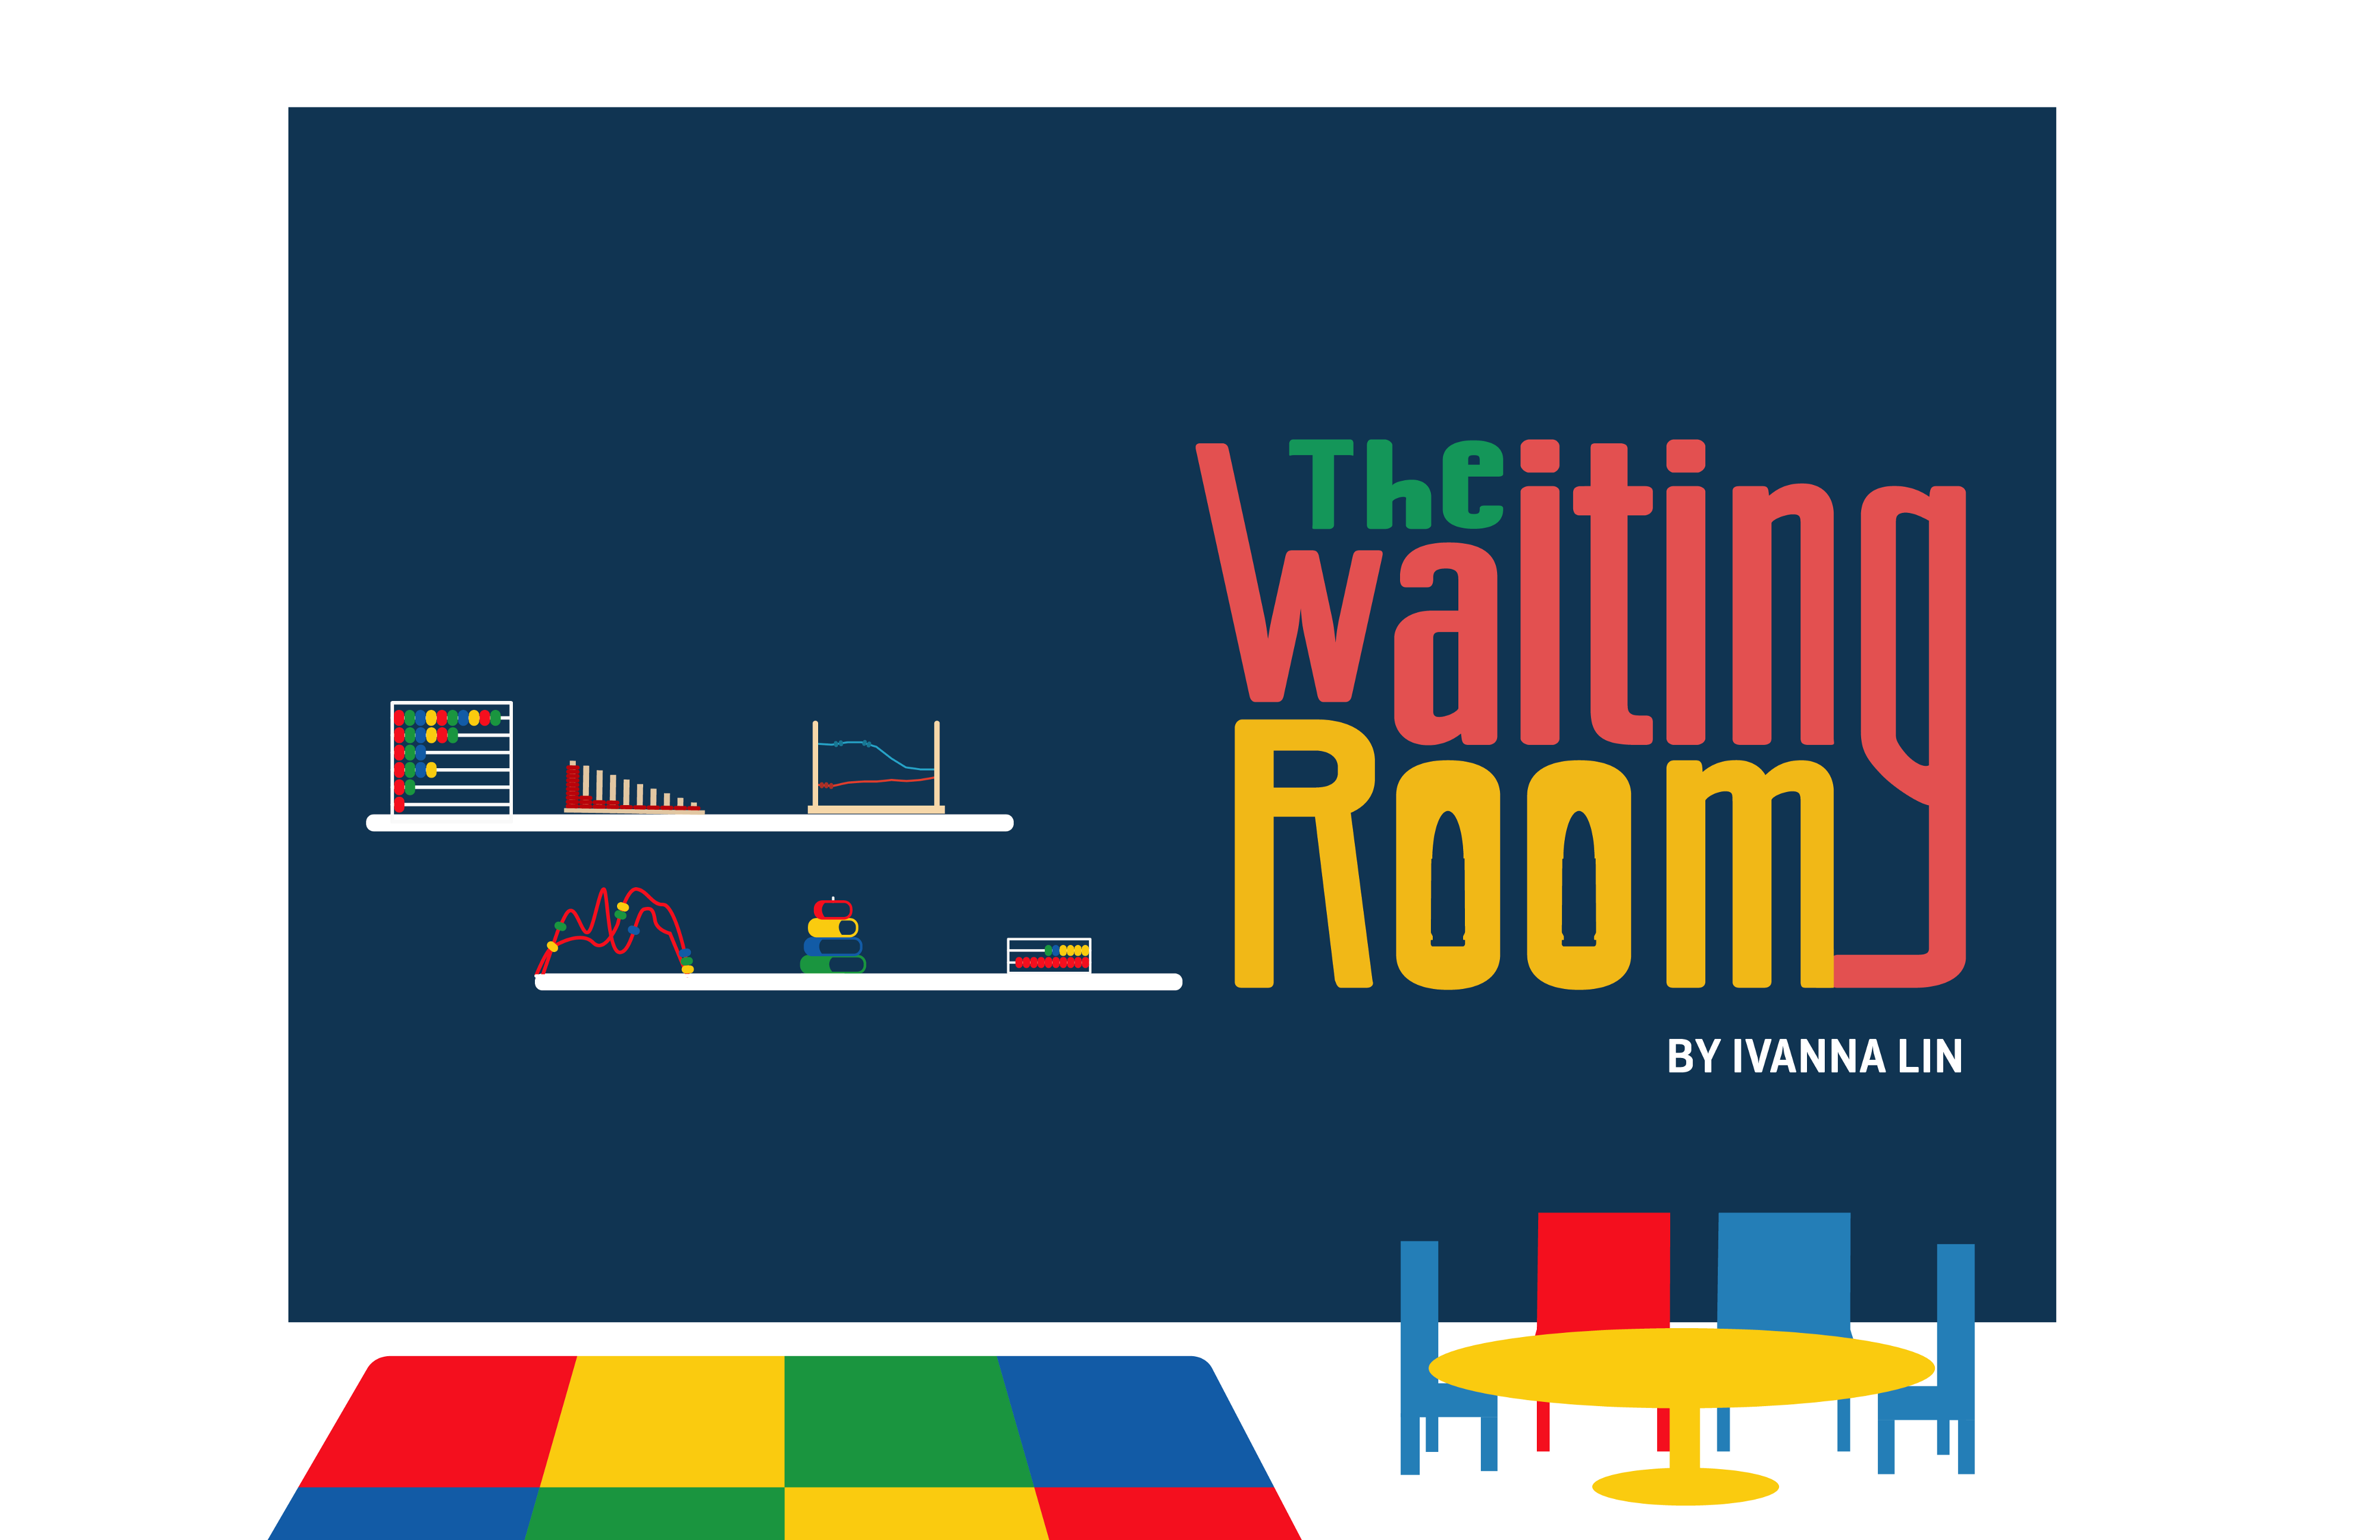
Project Title: The Waiting Room
Project Title: The Waiting Room
Project Description:
We face numbers and data on a daily basis. Advertisement often uses them to tell consumers why they need a product. Non-profit organizations influence people to take action with statistics. Article headlines finish “did you know” with alarming facts to hook you into reading the rest of the article. It is no surprise that the media understands the power of data. But with the large quantity of statistical numbers exposed to the public, has it lost its impact?
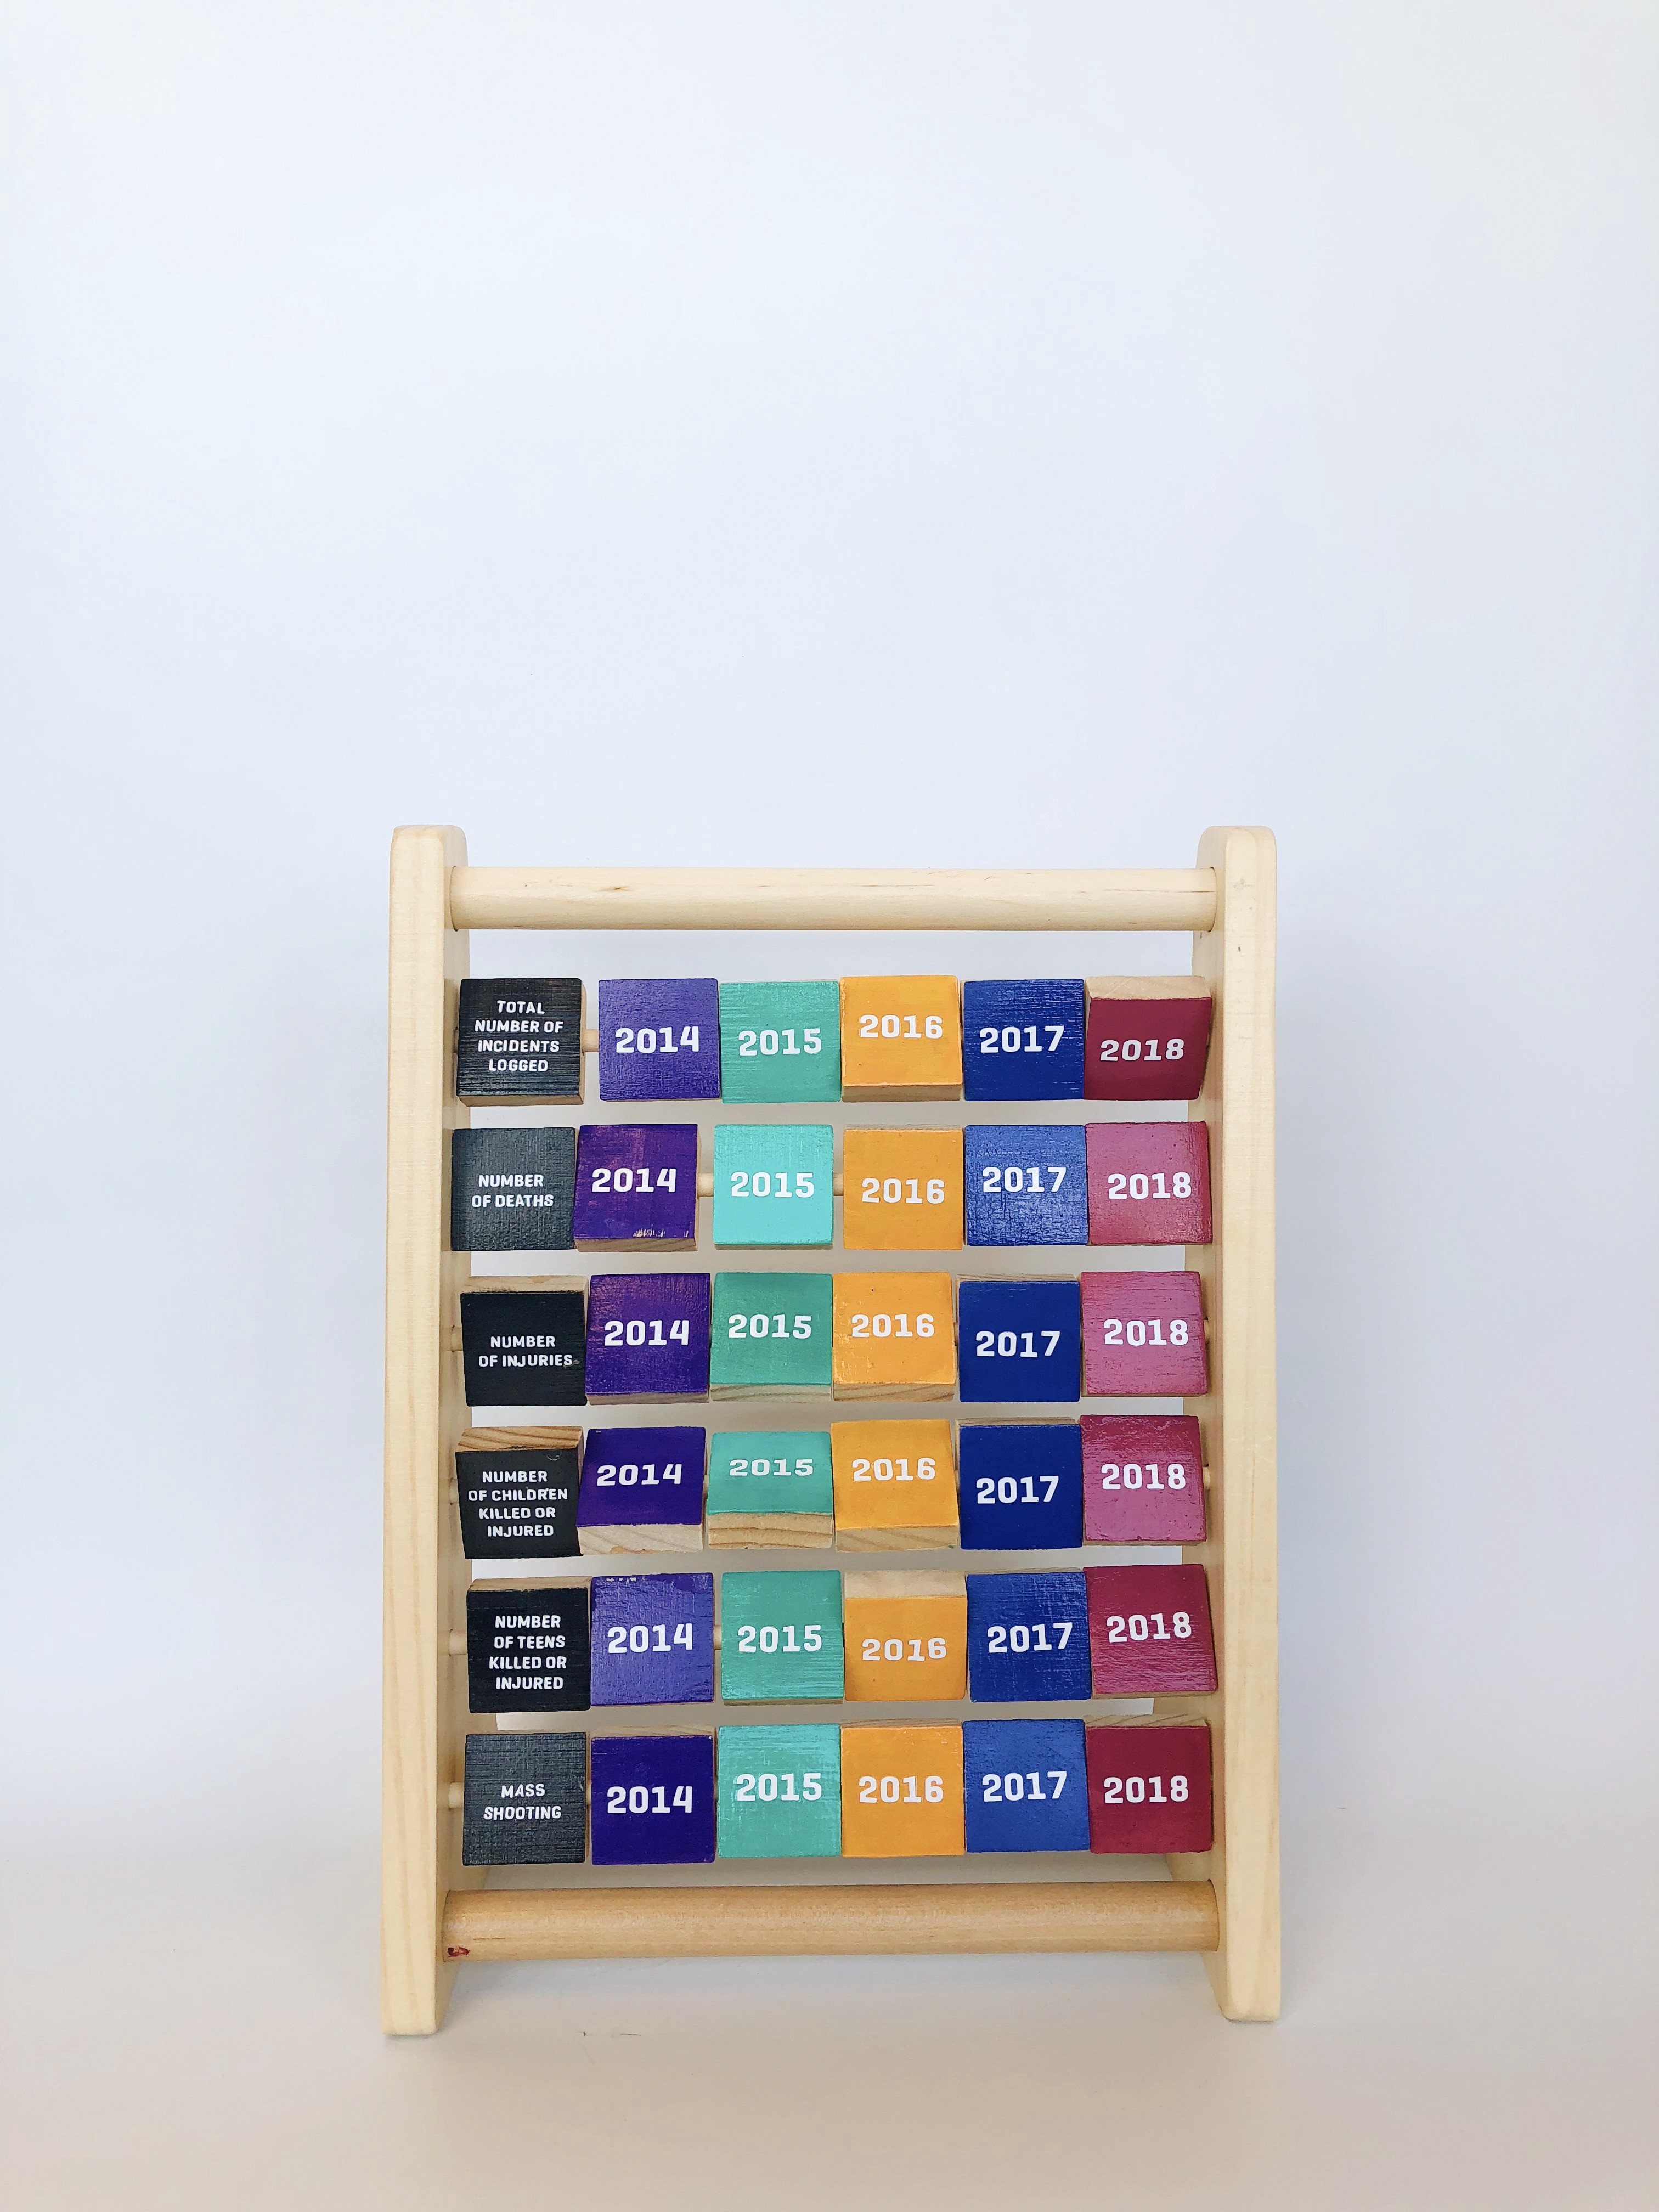
For my thesis, I want to investigate new ways to display data points.
The goal of my thesis is to allow the audience to understand the data beyond solely numbers. We are used to seeing percentages, fractions, pie charts, and bar graphs as forms of data visualization. These visual formulas are identifiable but tedious to fully understand because of how universally applicable they are. I hope to curate an experience that can allow people to not only know information but also feel it.
READ FULL BLOG POST


